
Welcome back to the Thelander Digest. This month we’re exploring compensation trends for CVC Unit Leaders and Corporate Venture Business Development (CVBD) Leaders. We particularly look at how the median and 75th percentile in total cash has changed since 2019. Let’s dive into the data!
Chart 1 shows how the median total cash for CVC Unit Leaders and CVBD Leaders has changed from 2019 to 2023.
- CVC Unit Leaders: 2021 and 2022 were banner years with the highest median total cash. The median total cash peaked at $433,000 in 2022, before leveling off at $422,150 in 2023.
- CVBD Leaders: The median total cash peaked in 2020 at $355,000. 2021 was a close-second at $348,800. The last two years have been consistent with the median total cash leveling off at $294,000.
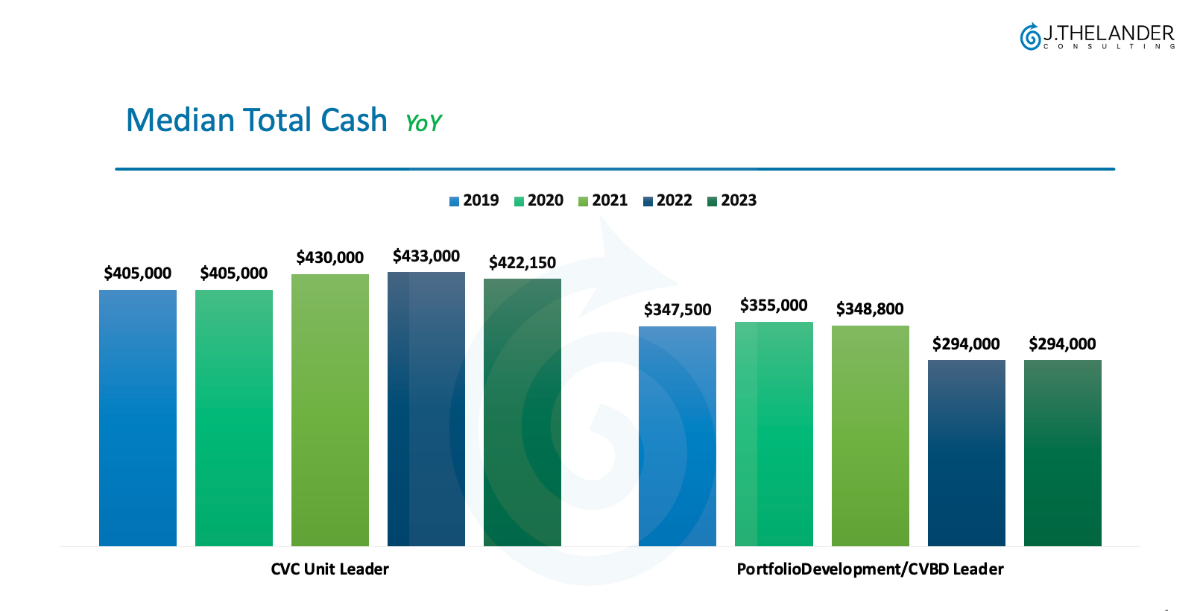
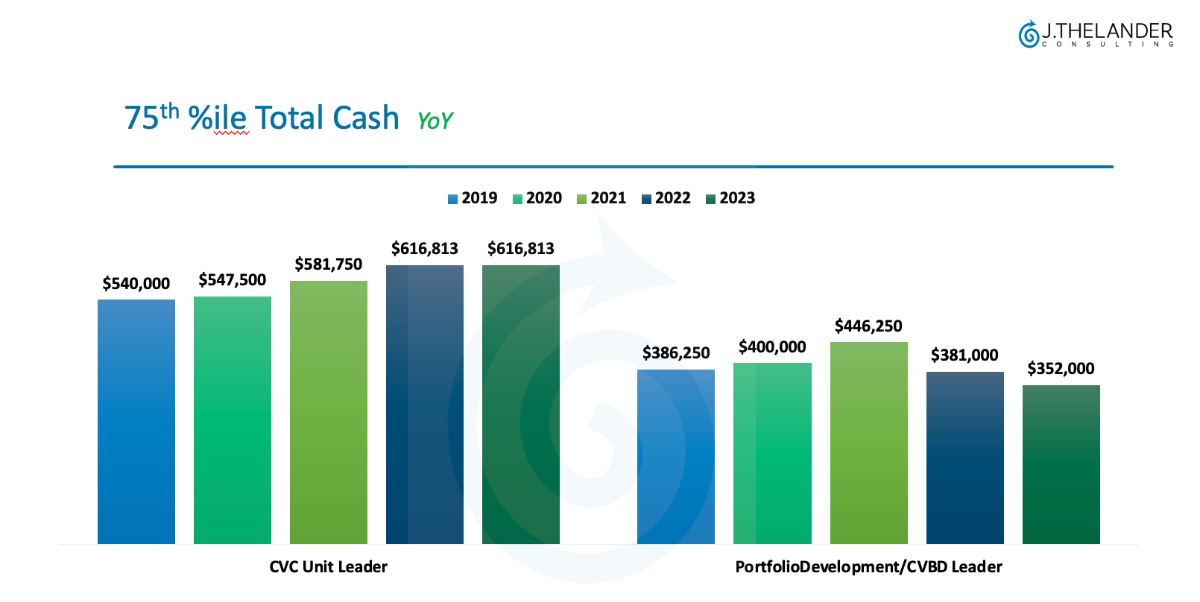
Chart 2 shows the 75th percentile in total cash for CVC Unit Leaders and CVBD Leaders.
- The 75th percentile has increased steadily for CVC Unit Leaders since 2019, from $540,000 (2019) to $616,813 (2023).
- The 75th percentile for CVBD leaders peaked in 2021 at $446,250.
Our Findings:
Overall, CVC compensation has been stable since 2019, with a slight uptick when the private markets have been at a peak. As our founder & CEO, Jody Thelander, says “it takes a lot of data to move a median. When the hiring market is hot, we see investment firms (and private companies) utilize higher percentiles, such as the 75th percentile and maximum numbers, to compete for key talent.”
Know someone that would find this data interesting?
Invite them to subscribe to the Thelander Monthly Digest here.
Participate in the CVC Compensation Survey Today For MORE Compensation Data
We invite you to participate in the no cost Thelander Investment Firm-CVC Compensation Survey. All participants receive a complimentary silver subscription for the year that includes investment firm and CVC compensation data.
| We invite you to participate in the no cost Thelander Investment Firm-CVC Compensation Survey. All participants receive a complimentary silver subscription for the year that includes investment firm and CVC compensation data. |